When using a personal VPN at home, one of the biggest problems I’ve faced was the inability to access public streaming services. I don’t care about watching Netflix from another country, I just want to be able to use my local internet connection for this kind of traffic while still encrypting everything else. This problem is commonly known in network engineering as “local internet breakout” and is often implemented at remote branch/edge sites to save costs of transporting SaaS traffic (e.g. Office365) over the VPN infrastructure. These “local breakout” solutions often rely on explicit enumeration of all public IP subnets, which is a bit cumbersome, or require “intelligent” (i.e. expensive) DPI functionality. However, it is absolutely possible to build something like this for personal use and this post will demonstrate how to do that.
Solution Overview
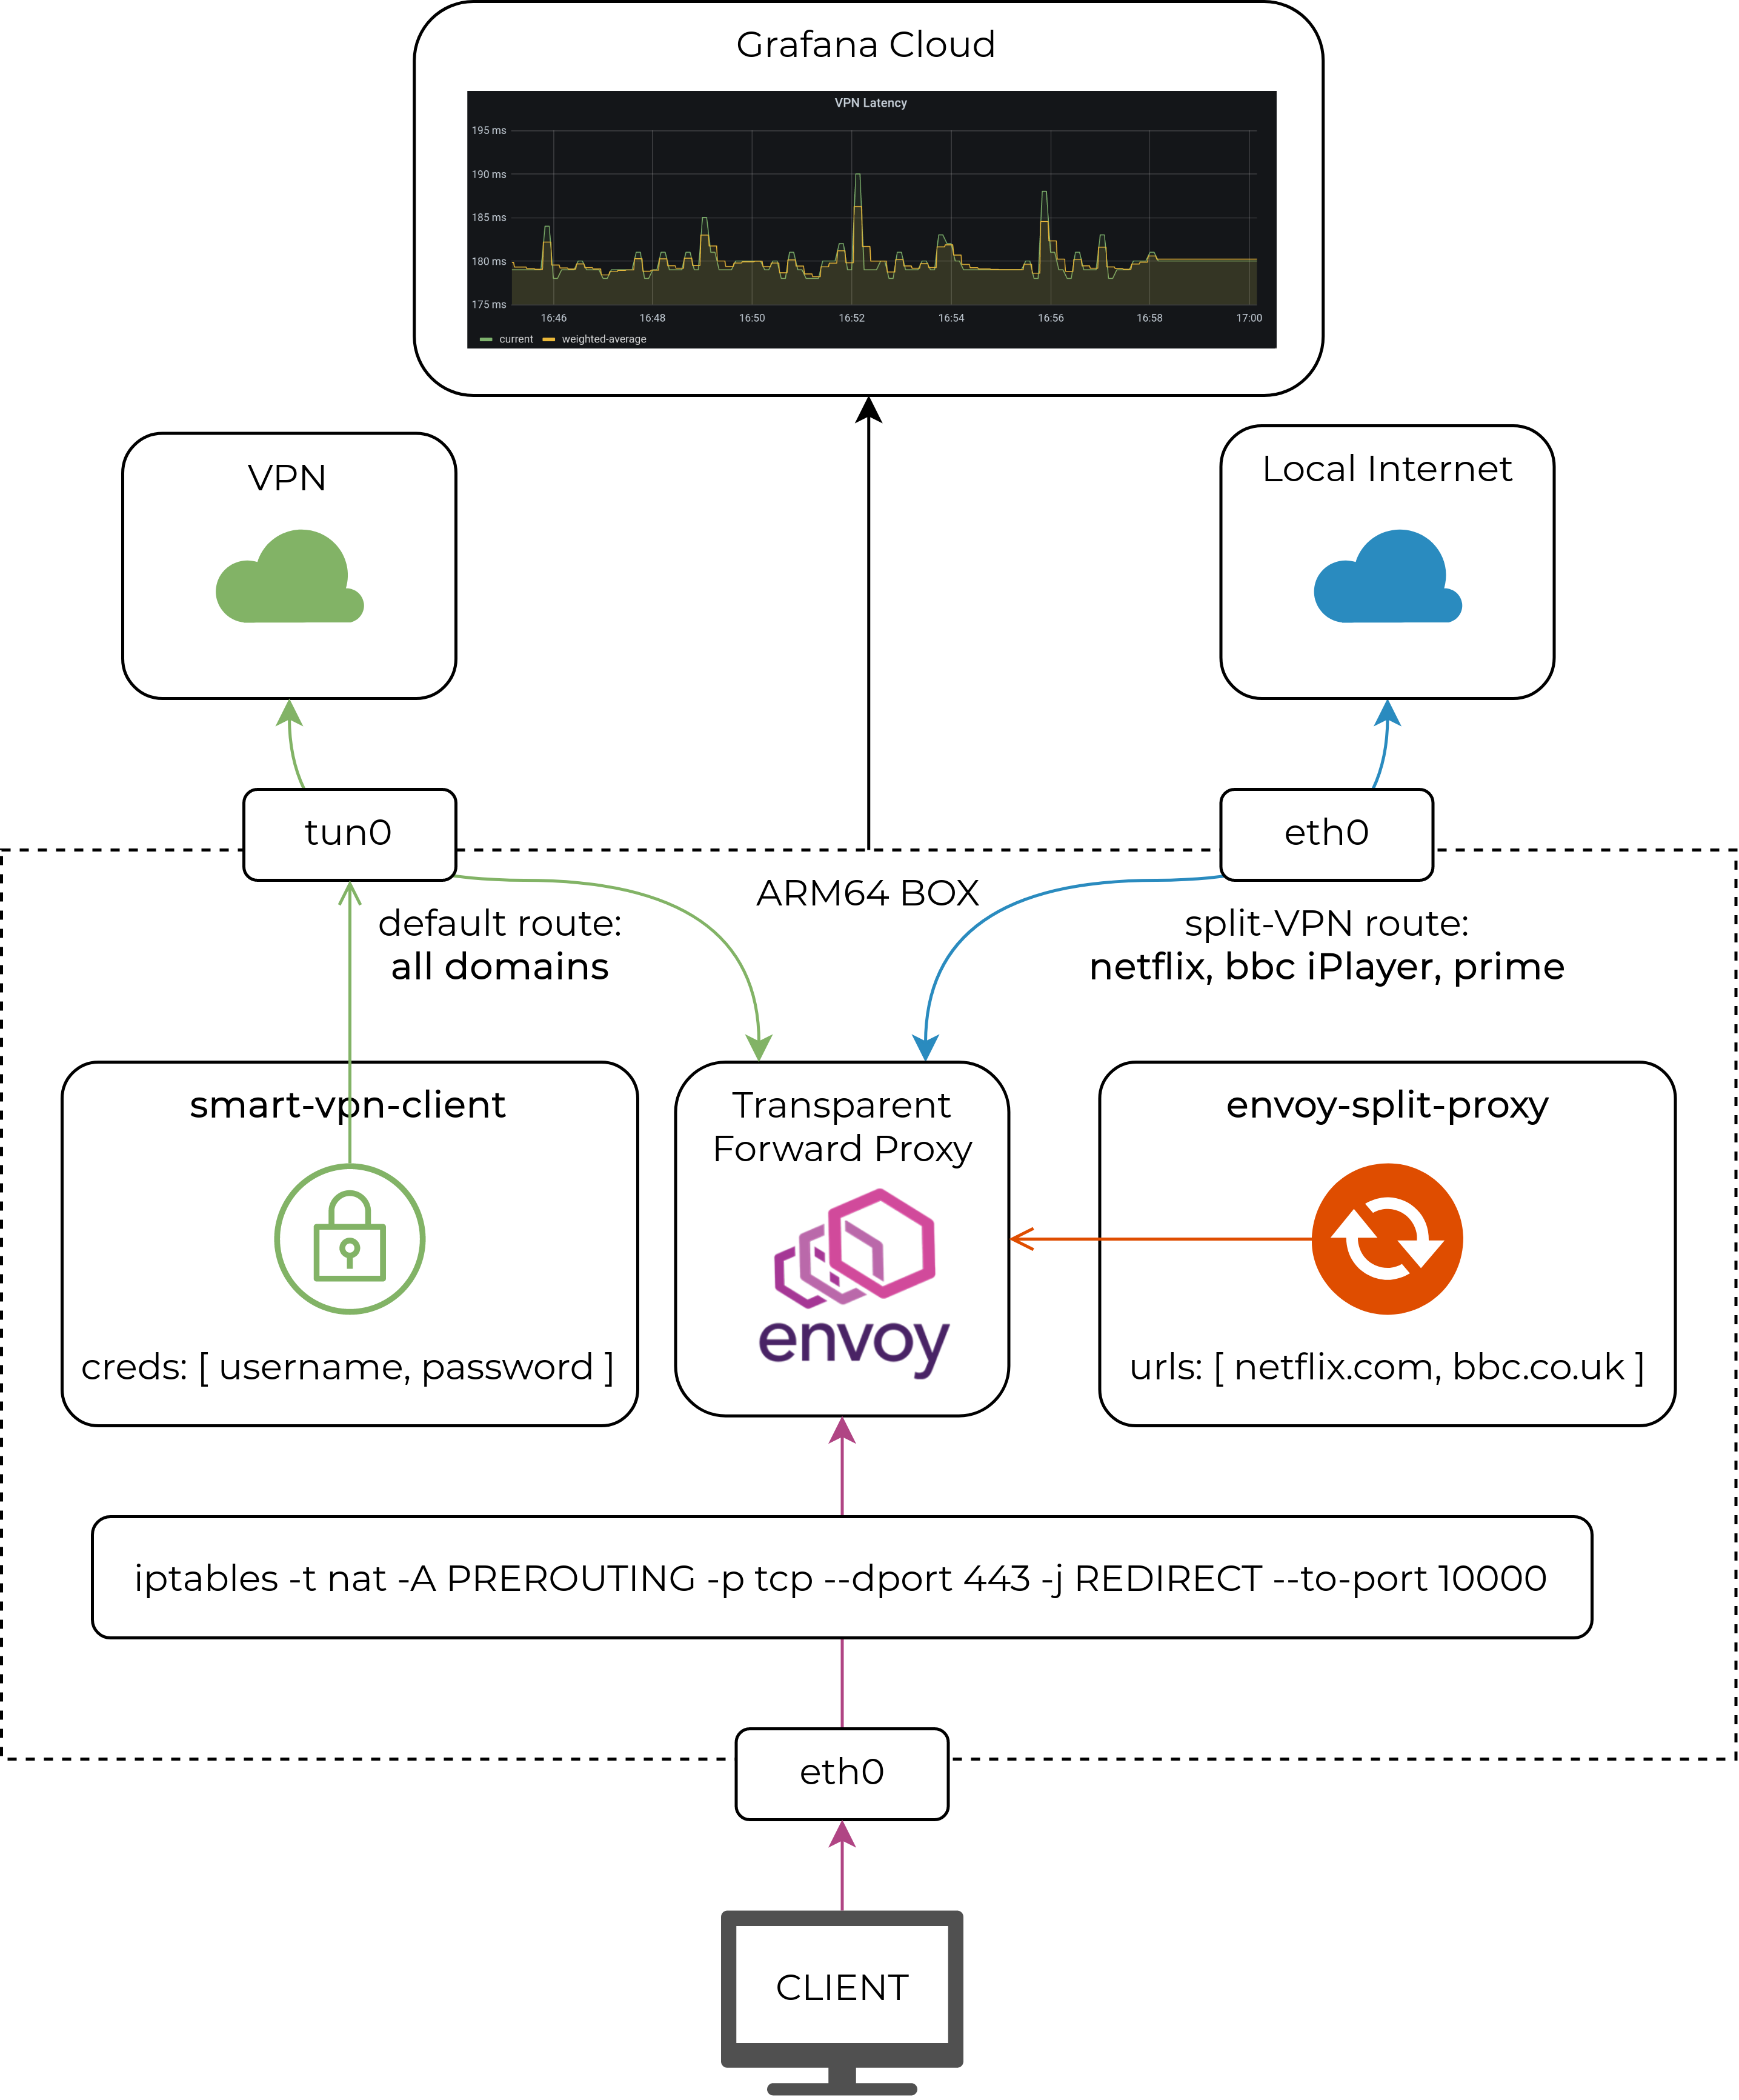
The problem scope consists of two relatively independent areas:
Traffic routing - how to forward traffic to different outgoing interfaces based on the target domain.
VPN management - how to connect to the best VPN gateway and make sure that connection stays healthy.
Each of one these problem areas is addressed by a separate set of components.
VPN management is solved by:
- A smart-vpn-client agent that discovers all of the available VPN gateways, connects to the closest one and continuously monitors the state of that connection.
Traffic routing is solved by:
A transparent proxy (Envoy), capable of domain- and SNI-based routing and binding to multiple outgoing interfaces.
A proxy controller called envoy-split-proxy, that monitors the user intent (what traffic to route where) and ensures that Envoy configuration is updated accordingly.
An extra bonus is a free-tier monitoring solution based on Grafana Cloud that scrapes local metrics and pushes them to the managed observability platform.
Below, I’ll walk through the component design and steps of how to deploy this solution on a Linux-based ARM64 box (in my case it’s a Synology NAS). The only two prerequisites that are not covered in this blogpost are:
- Docker support on the target ARM64 box (see this guide for Synology)
- Wireguard kernel module loaded on the target ARM64 box (see this guide for Synology)
Smart VPN Client
At its core, the smart-vpn-client implements a standard set of functions you’d expect from a VPN client, i.e.:
- Discovers all of the available VPN gateways (exit nodes) it can connect to.
- Measures the latency and selects the “closest” gateway for higher throughput.
- Configures the wireguard interface and associated routing policies.
The only supported VPN provider at this stage is PIA, so the discovery and VPN setup is based on the instructions from the pia-foss repo.
The “smart” functionality is designed to maintain a consistent user experience in the presence of network congestion and VPN gateway overloading and it does that by resetting a VPN connection if it becomes too slow or unresponsive. Translated to technical terms, this is implemented as the following sequence of steps :
- When a new VPN connection is set up, we record the “baseline” round-trip time over it.
- Connection health monitor periodically measures the RTT and maintains a record of the last 10 values.
- At the end of each measurement, connection health is evaluated and can be deemed degraded if either:
- No response was received within a timeout window of 10s.
- The exponentially weighted average of the last 10 measurements exceeded 10x the “baseline”.
- If health stays degraded for 3 consecutive measurement intervals, the VPN connection is re-established to the new “closest” VPN gateway.
The VPN client binary can be built from source or downloaded as a docker image, which is how I’m deploying it:
#!/bin/sh
docker pull networkop/smart-vpn-client

docker rm -f vpn
docker run --privileged networkop/smart-vpn-client -cleanup
docker run -d --name vpn --restart always --net host \
--env VPN_PWD=<VPN-PASSWORD> \
--privileged \
networkop/smart-vpn-client \
-user <VPN-USER> -ignore=uk_2
The above script creates a new container attached to the root network namespace. We can see the main steps it went through in the logs:
$ docker logs vpn
level=info msg="Starting VPN Connector"
level=info msg="Ignored headends: [uk_2]"
level=info msg="VPN provider is PIA"
level=info msg="Discovering VPN headends for PIA"
level=info msg="Winner is uk with latency 14 ms"
level=info msg="Brining up WG tunnel to 143.X.X.X:1337"
level=info msg="Wireguard Tunnel is UP"
level=info msg="New baseline is 202 ms; Threshold is 2020"
Now we can verify that the wireguard tunnel has been set up:
$ sudo wg show
interface: wg-pia
  public key: MY_PUBLIC_KEY
  private key: (hidden)
  listening port: 34006
  fwmark: 0xea55

peer: PEER_PUBLIC_KEY
  endpoint: 143.X.X.X:1337
  allowed ips: 0.0.0.0/0
  latest handshake: 1 minute, 21 seconds ago
  transfer: 3.29 GiB received, 1.03 GiB sent
  persistent keepalive: every 15 seconds
Envoy Split Proxy
Split tunneling is a technique commonly used in VPN access to enable local internet breakout for some subset of user traffic. It works at Layer 3, so the decision is made based on the contents of a local routing table. What I’ve done with Envoy is effectively taken the same idea and extended it to L4-L7, hence the name split proxy. The goal was to make L4-L7 split-routing completely transparent to the end-user, with no extra requirements (e.g. no custom proxy configuration) apart from a default route pointing at the ARM64 box. This goal is achieved by a combination of:
- Envoy proxy acting as a configurable dataplane for L4-L7 traffic.
- IPTables redirecting all inbound TCP/80 and TCP/443 traffic to envoy listeners.
- XDS controller that configures envoy to act as a transparent forward proxy based on the user intent.
The user intent is expressed as a YAML file with the list of domains and the non-default interface to bind to when making outgoing requests. This file is watched by the envoy-split-proxy application and applied to envoy on every detected change.
interface: eth0
urls:
## Netflix
- netflix.com
- "*.nflxso.net"
All other domains will be proxied and sent out the default (wireguard) interface, so the above file only defines the exceptions. One obvious problem is that streaming services will most likely use a combination of domains, not just their well-known second-level domains. The domain discovery process may be a bit tedious but only needs to be done once for a single streaming service. Some of the domains that I use are already documented in the source code repository.
Similar to the VPN client, all software can be deployed directly on ARM64 box as binaries, or as docker containers. Regardless of the deployment method, the two prerequisites are the user intent YAML file and the Envoy bootstrap configuration that makes it connect to the XDS controller.
$ curl -O https://raw.githubusercontent.com/networkop/envoy-split-proxy/main/envoy.yaml
$ curl -O https://raw.githubusercontent.com/networkop/envoy-split-proxy/main/split.yaml
With those files in the pwd we can spin up the two docker containers with the following script:
#!/bin/sh

docker pull networkop/envoy-split-proxy
docker pull envoyproxy/envoy:v1.16.2

docker rm -f app
docker rm -f envoy

docker run -d --name app --restart always --net host \
-v $(pwd)/split.yaml:/split.yaml \
networkop/envoy-split-proxy \
-conf /split.yaml

docker run -d --name envoy --restart always --net host \
-v $(pwd)/envoy.yaml:/etc/envoy/envoy.yaml \
envoyproxy/envoy:v1.16.2 \
--config-path /etc/envoy/envoy.yaml \
Finally, all transit traffic needs to get redirected to envoy with a couple of iptable rules:
#!/bin/sh
sudo iptables -t nat -D PREROUTING -p tcp --dport 443 -j REDIRECT --to-port 10000
sudo iptables -t nat -D PREROUTING -p tcp --dport 80 -j REDIRECT --to-port 10001

sudo iptables -t nat -A PREROUTING -p tcp --dport 443 -j REDIRECT --to-port 10000
sudo iptables -t nat -A PREROUTING -p tcp --dport 80 -j REDIRECT --to-port 10001
Monitoring
Observability is the critical part of any “software-defined” networking product, so our solution shouldn’t be an exception. It’s even easier when we don’t have to manage it ourselves. Thanks to Grafana Cloud’s forever free plan, all we have to do is deploy a grafana agent and scrape metrics exposed by envoy and smart-vpn-client. In order to save on resource utilisation (both local and cloud), I’ve disabled some of the less interesting collectors and dropped most of the envoy metrics, so that the final configuration file looks like this:
integrations:
  node_exporter:
    enabled: true
    disable_collectors:
      - bonding
      - infiniband
      - ipvs
      - mdadm
      - nfs
      - nfsd
      - xfs
      - zfs
      - arp
      - btrfs
      - bcache
      - edac
      - entropy
      - pressure
      - rapl
      - softnet
  prometheus_remote_write:
    - basic_auth:
        password: <PWD>
        username: <USERNAME>
      url: https://prometheus.grafana.net/api/prom/push
prometheus:
  configs:
    - name: integrations
      remote_write:
        - basic_auth:
            password: <PWD>
            username: <USERNAME>
          url: https://prometheus.grafana.net/api/prom/push
      scrape_configs:
      - job_name: vpn
        scrape_interval: 5s
        static_configs:
        - targets: ['localhost:2112']
      - job_name: envoy
        metrics_path: /stats/prometheus
        metric_relabel_configs:
        - source_labels: [__name__]
          regex: ".+_ms_bucket"
          action: keep
        - source_labels: [envoy_cluster_name]
          regex: "xds_cluster"
          action: drop
        static_configs:
        - targets: ['localhost:19000']
  global:
    scrape_interval: 15s
The script to enable grafana agent simply mounts the above configuration file and points the agent at it:
#!/bin/sh

docker rm -f agent
docker run -d --name agent --restart always --net host \
-v /tmp/grafana-agent-wal:/etc/agent \
-v $(pwd)/config.yaml:/etc/agent-config/agent.yaml \
grafana/agent:v0.12.0 --config.file=/etc/agent-config/agent.yaml --prometheus.wal-directory=/etc/agent/data
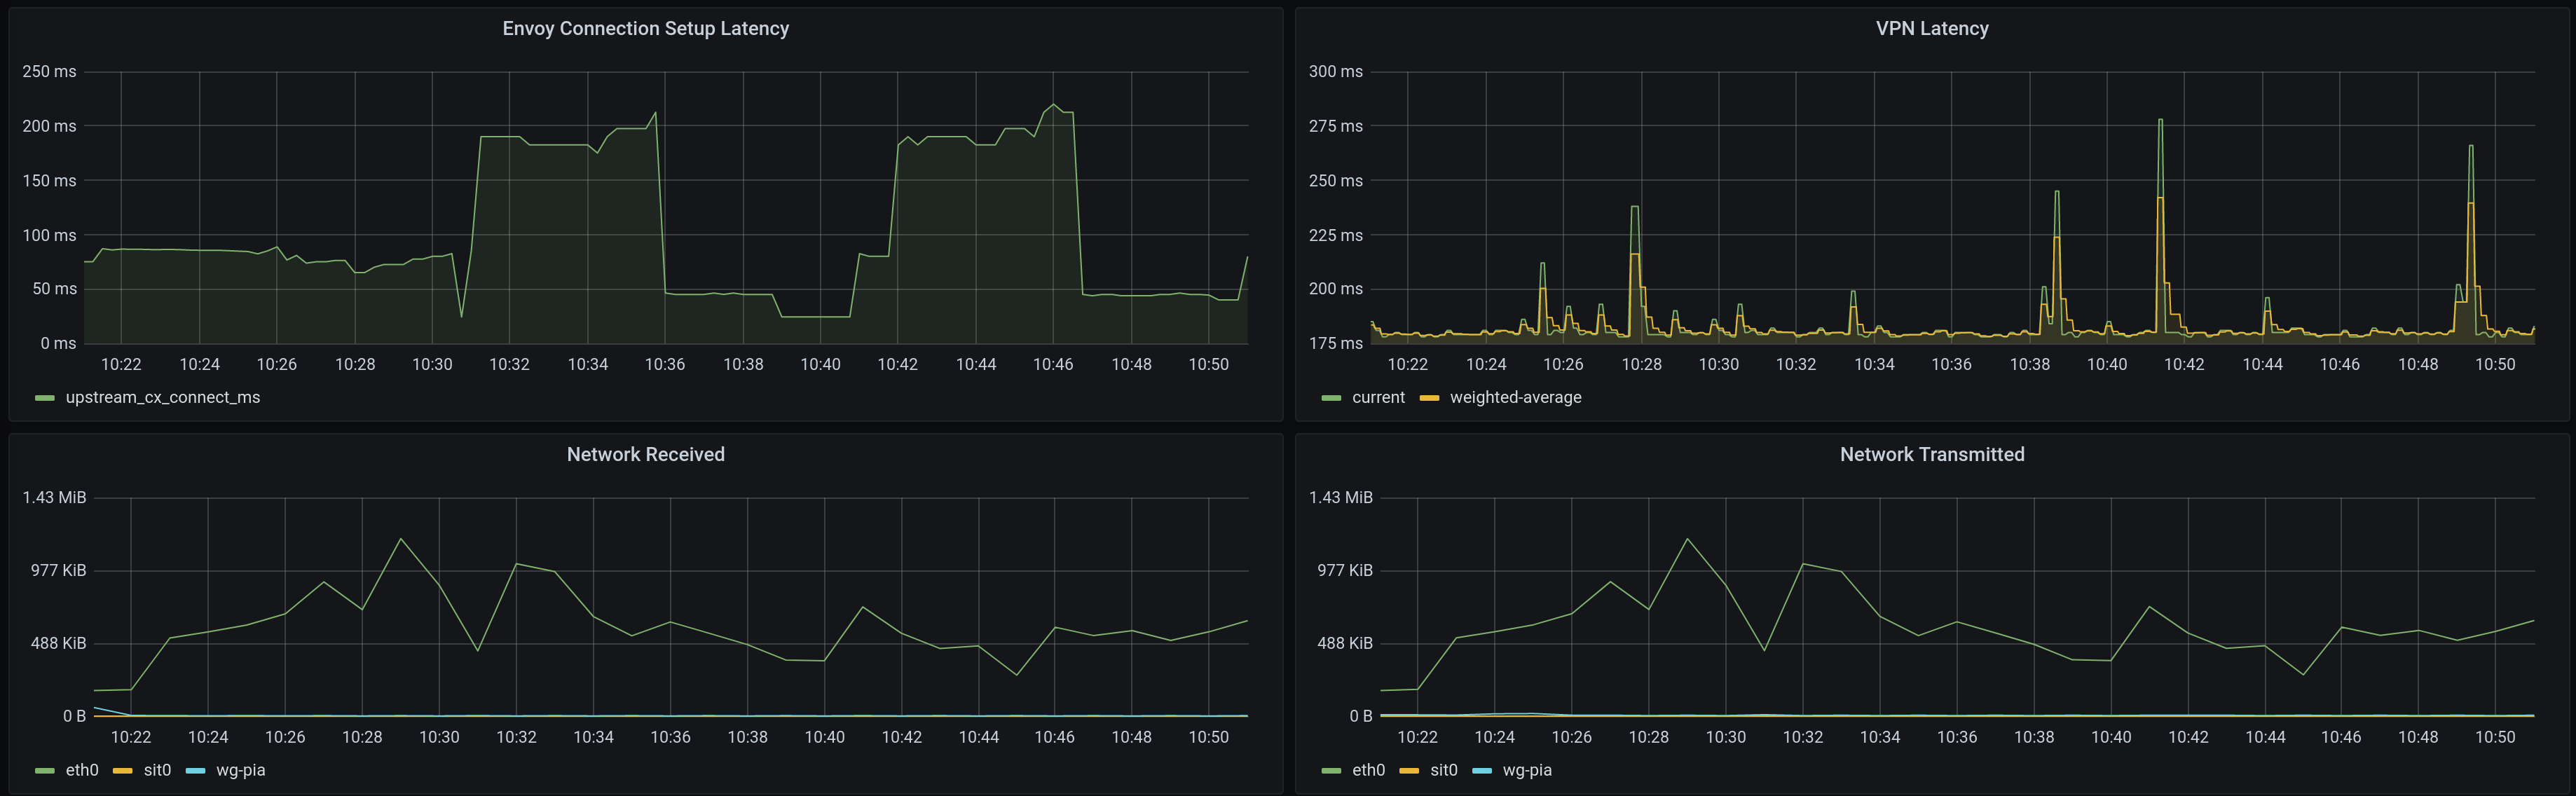
The collected metrics can be displayed in a beautiful dashboard allowing us to correlate network throughput, VPN healthchecks and proxy connection latencies.
Credits
Building something like this would have been a lot more difficult without other FOSS projects:
- Envoy proxy - the most versatile and feature-rich proxy in the world today.
- Wireguard and wgctrl Go package to manage all interface-related configurations.
- Grafana Cloud’s with their free tier plan which is a perfect fit for personal/home use.